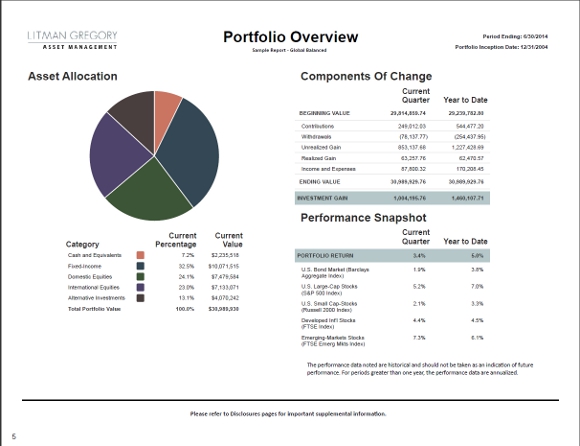
Here are the basic steps:
- Open Presentation Studio
- Under Pages, Right Click and select New Page
- Navigate through the choices to find: Three Pane Right Stacked Layout
- Give your page a title
- Set the Theme to your favorite theme
- Change default to Landscape
Next, drag the following elements to the following places:
- Left Pane – Asset Allocation Chart & Table
- Top Right – Components of Change Table
- Bottom Right – Performance vs Benchmarks Table
- Save your new page
Now add your new page to your desired Presentation or create a new Presentation for it. At this point, you can make the rest of the customizations.
- Change default to Landscape if necessary)
- Change the Graph Size 2;25 (depending on your theme and font choices, you may want a smaller or larger graph; play with the size until it works)
- Graph Position: Above Legend
- The performance format in the example is 14.
- Customize the date ranges and footers to your preferences
I would suggest replacing the “Components of Change” title with Performance Snapshot and omitting the title about the returns. In my experience, clients find the term “components of change” confusing.
Save your presentation, test it on a few clients and your good to go!
Need help?


